I use my personal server as a guinnea pig to push my server administrative skills to the edge and help bleed as much performance out of Drupal. So not even an hour and a half ago I signed up for New Relic and installed their monitoring daemon on my server. And I'm in love. The installation was ridiculously easy that even a novice who is scared of the terminal could pull it off.
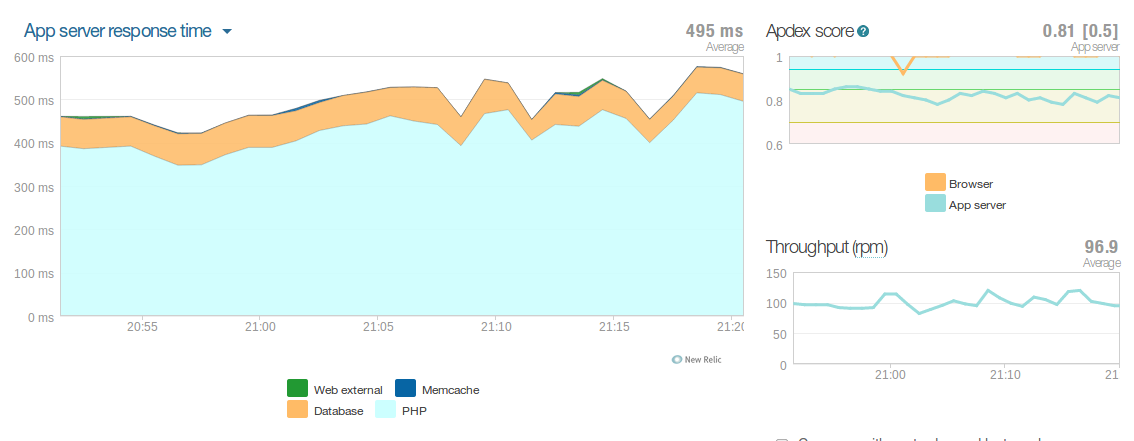
Right off the bat New Relic was letting me know where my server's time was being spent. The graph pictured above detailed the server's time spread, how much time in PHP, the database, or memached. You can also switch and view the data from the browser's timeline. Pretty awesome to see real data about page rendering, DOM processing, network, and web application optimization.
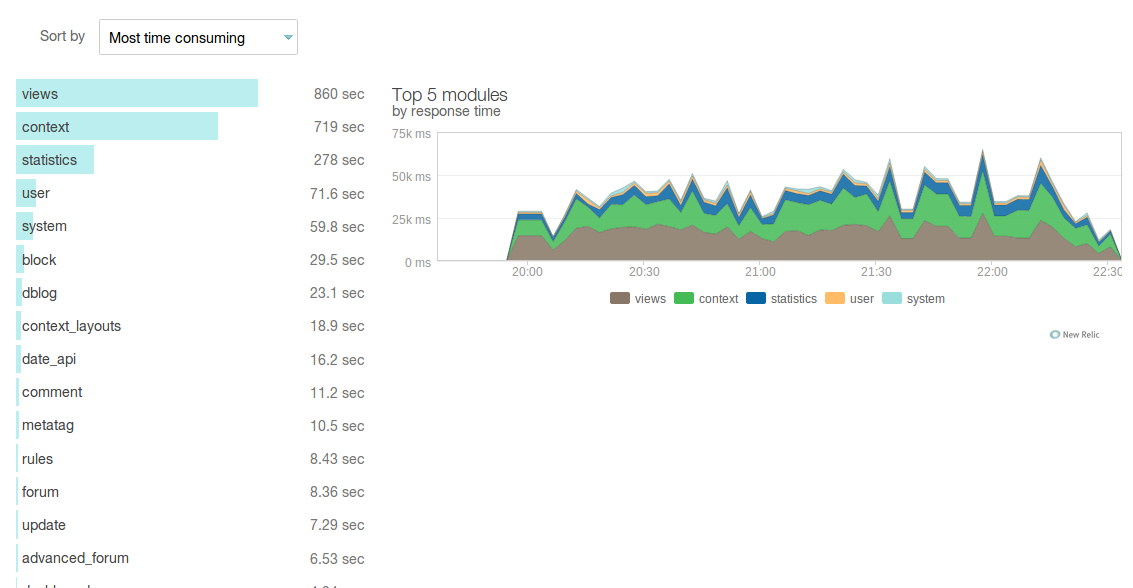 I got really excited when I noticed the "Drupal" menu section. New Relic is such a sweet heart and allows us Drupal folk to break down our installations by Modules, Hooks, and Views. I didn't even know a site on my server had Statistics enabled! But now I do.
You can sort Modules by the number of function call count, slowest call time, and most time consuming (which Views will most likely always dominate.)
The Views breakdown is great. You can also sort Views by most time consuming, slowest, and the function call out. To me having this kind of data for Views is amazing. Strong websites use a decent amount of data and try to be dynamic, dynamic data comes from the database, and Views is our transport. Unless you're utilizing Views cache bully it can be easy to forget about Views caching, and this is a hell of a reminder.
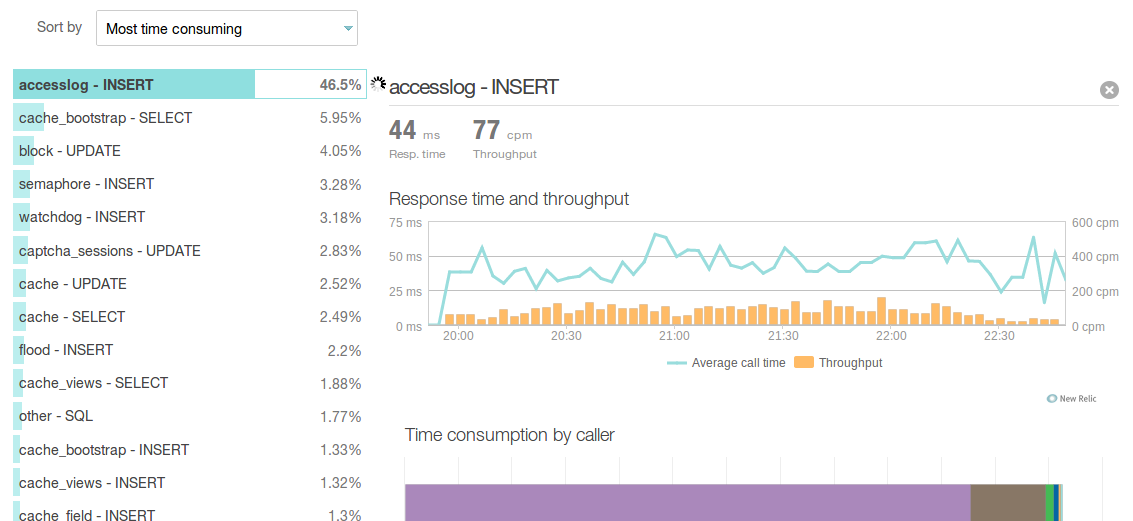
I am legitimately writing this post as I fully explore New Relic and fixing things as I go, such as finding out a site had Statistics on for no reason...and seeing the above query report with accesslog - INSERT. Know what you should do, right now? Get New Relic and turn off Devel's slow query log. The monitoring daemon has only been up for a few hours now and it has helped me find ways to lock down my Drupal sites a little bit more and hopefully give my server a little relaxing time.
There's much more to New Relic, such as Event tracking for errors, alerts, deployments. Everything covered so far can be exported as a report. Basically its a developer and sysadmin's dream; and this just covers the application monitoring, not even just the server monitoring.
Advice: get New Relic. Make life easier.
I'm available for one-on-one consulting calls – click here to book a meeting with me 🗓️
Want more? Sign up for my weekly newsletter