Late 2013 I became the maintainer of Commerce Reports, a module that provides reports on sales, customers, and products. There are two sub modules which integrate to provide tax and stock reports. All of the work for Commerce Reports is on my own time without sponsorship. I feel Drupal Commerce needs a reporting system in order to thrive amongst proprietary alternatives.
Features overview:
- Yearly, Monthly, Weekly, Daily sales reports
- Payment reports per different payment methods available
- Customer reports (order information per customer)
- Products reports, number sold and revenue.
- CSV data export of reports (if Views Data Export enabled.)
- Tax reporting (with use of tax report submodule.)
- Dashboard for commerce revenue overview
- Stock reports (with use of stock submodule.)
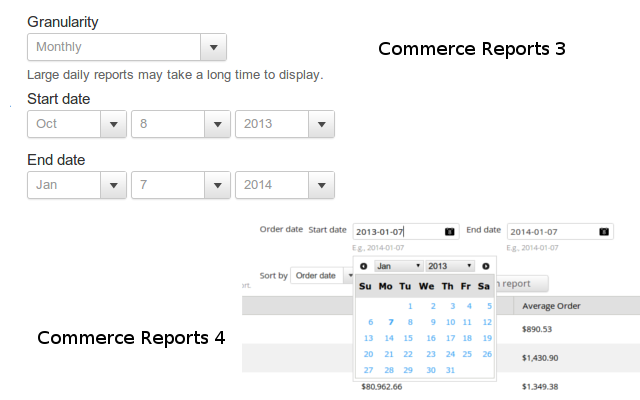
From Commerce Reports 3 and Commerce Reports 4.
Commerce Reports 3 utilized sales reports that were created from a Google Summer of Code project. The module was powered by a custom Views handler that provided granulated date ranges (a great feat thanks to cvangysel.) Alongside of Commerce Reports there was the Visualization API, a chart module created to power Commerce Report's charts.
However, there were some bugs with the custom granularity filter. Often times it was difficult to get the current month. Dashboard blocks queried Commerce Payment transactions without checking if the status was successful. There was a slew of minor issues that held back the module.
In November I became the module maintainer and began working at revamping the module. The first tasks were to decouple Commerce Report's requirement of Visualization API for a module that had its own maintainer and would not require side-by-side maintainence. Secondly was to fix report date grandularity to provide accurate reports.
Changes in Commerce Reports 4
I switched Commerce Reports to utilize Charts. There was a discussion in the issue queue on steps to take for the next maintainer, and Charts was suggested as it is up kept. Charts suggests using Views Date Format SQL for accurate date range reporting. So side-by-side I update Commerce Reports to utilize Views Date Format SQL to replace the current date granularity filter, and Charts to replace Visualization API.
The result was extremely accurate date statistics. I went through and began to optimize the Views created. All of the reports utilize Date Popup for choosing dates versus a dropdown for day, month, and year to improve usability. Payment reports required a relationship to their order to prevent orphaned payment transactions from being reported.
Another area touched was the Tax sub module. The tax module report has been converted to a View to allow per-need customization. It also bridges a relationship from the Commerce Order table to the Tax Reports table.
The dashboard blocks have been updated to utilize Views as well to allow per-need customizations. The customer map is no longer hardcoded and utilizes views with the Chart module to use Google Geomap display.
I'm available for one-on-one consulting calls – click here to book a meeting with me 🗓️